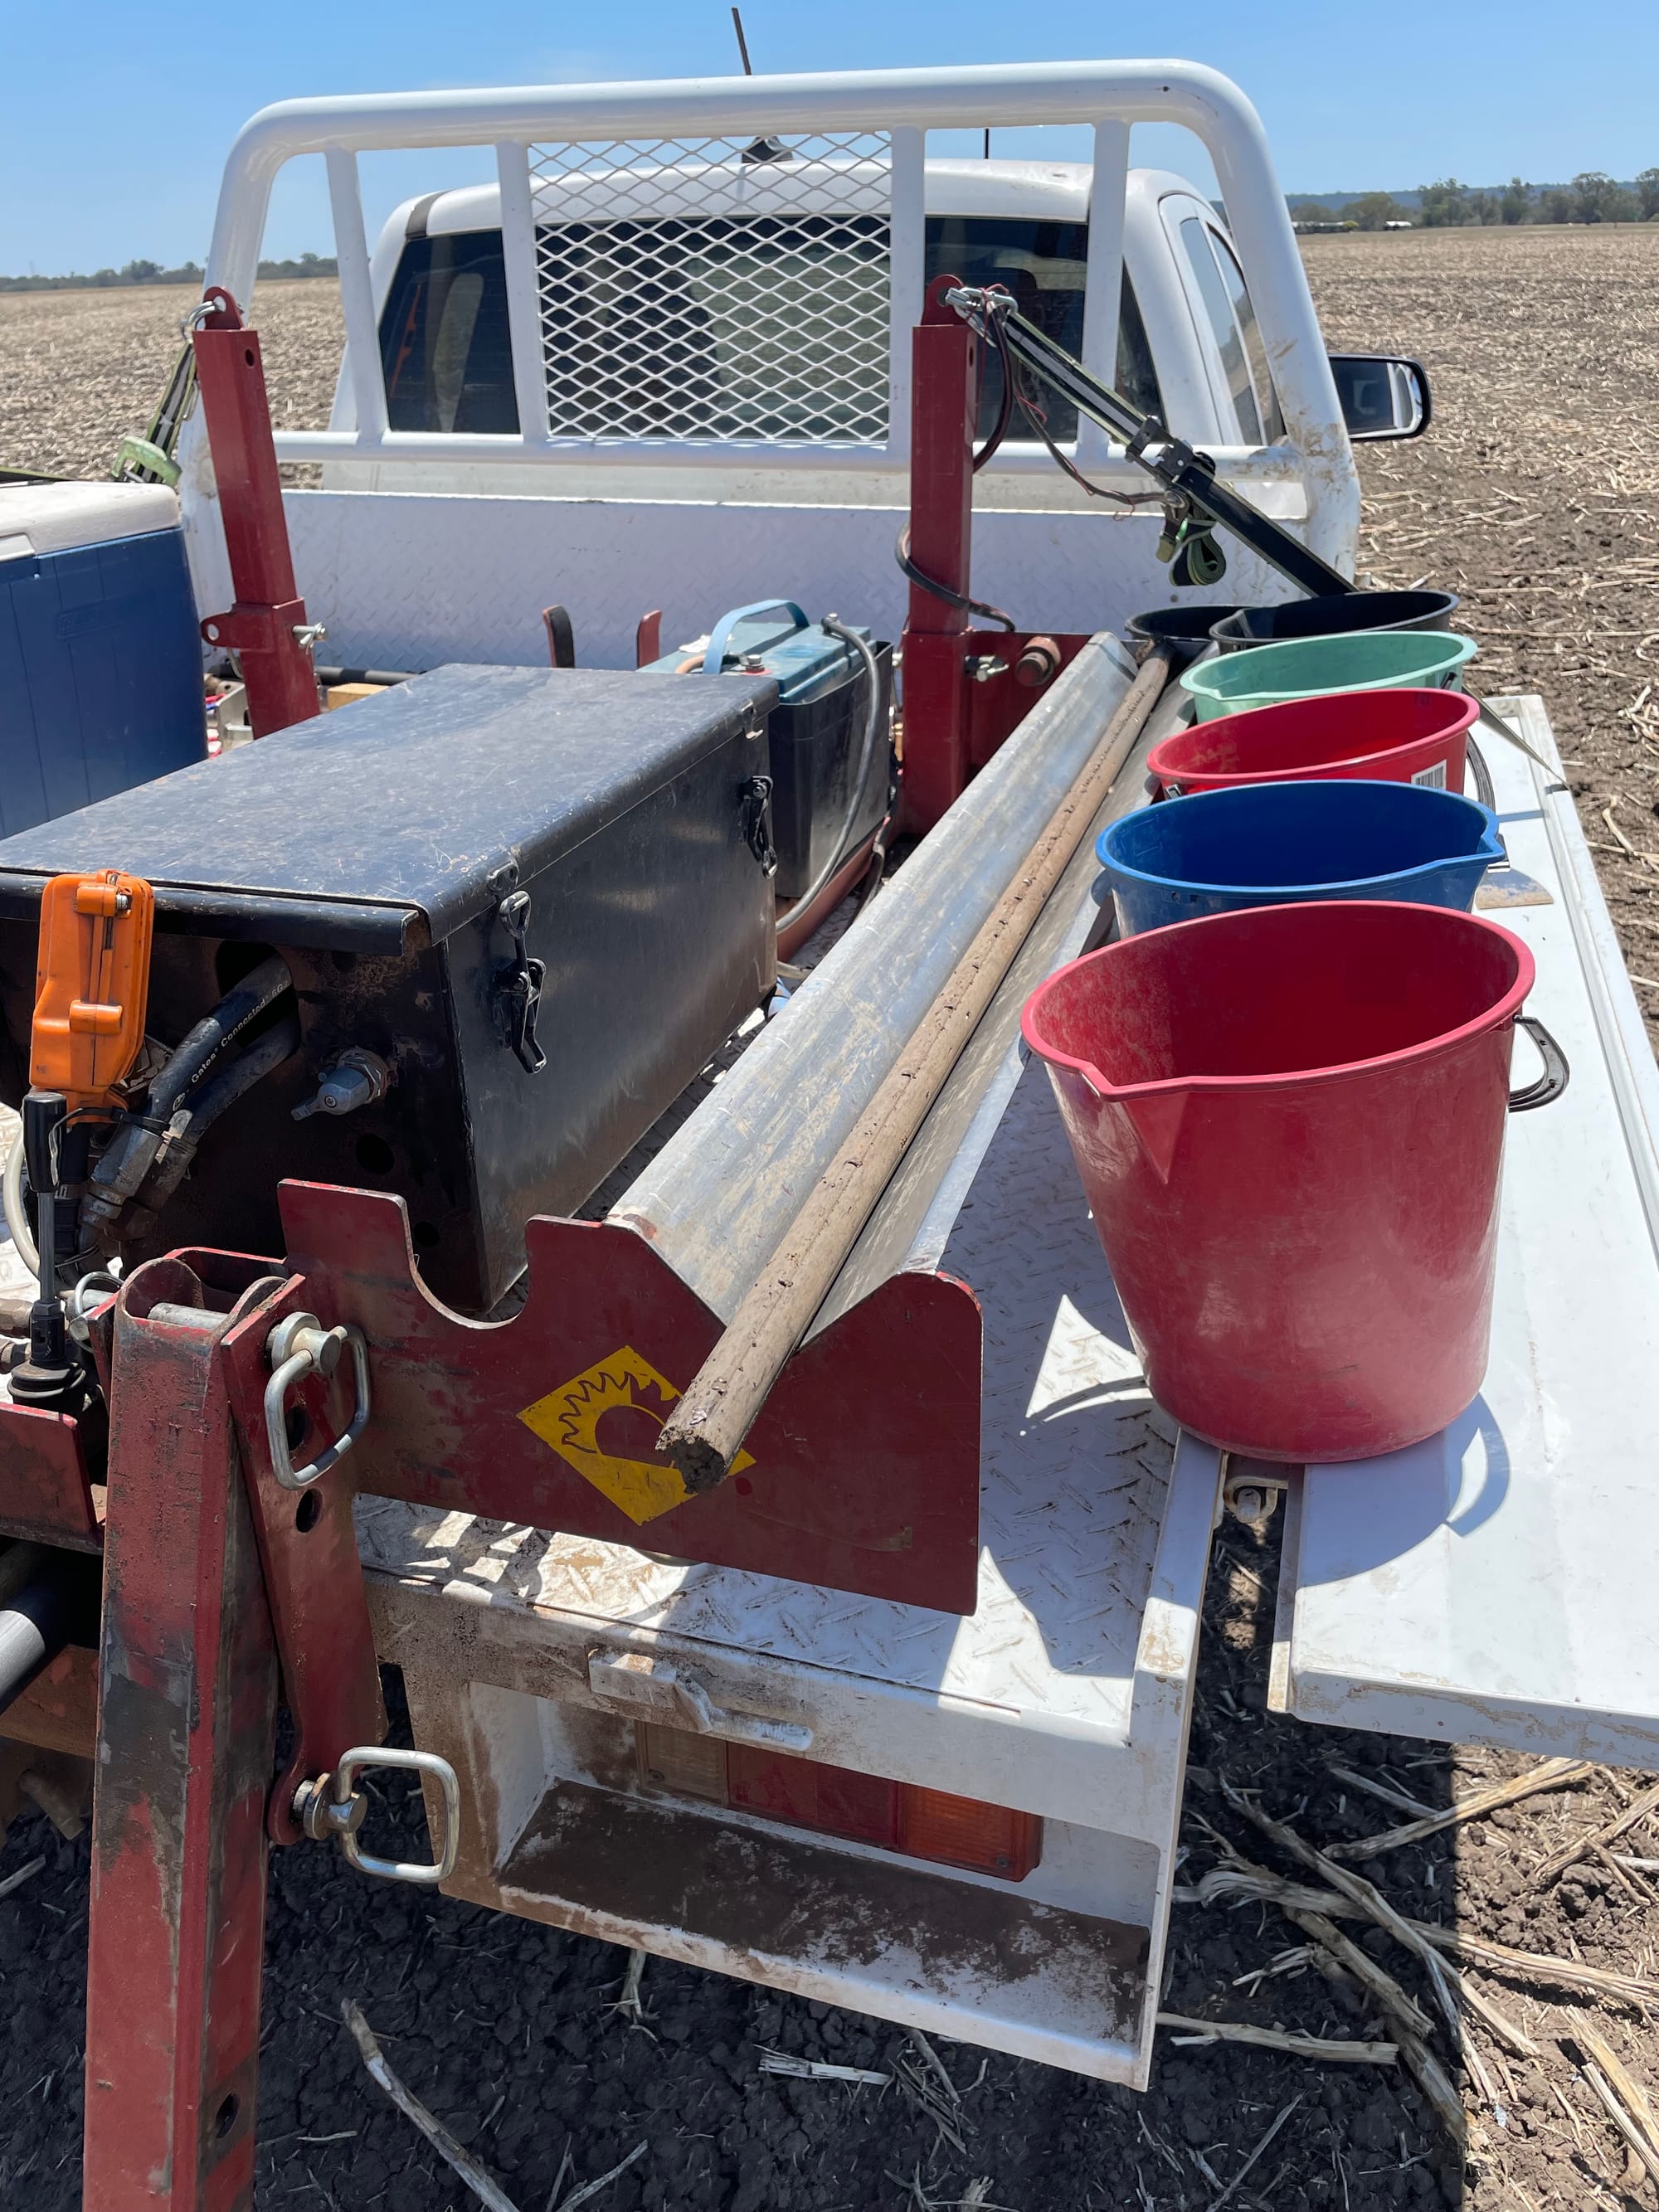
Soil Sampling

In science there are few things that are done without purpose or at least precedence and there is likely something interesting to be learned. If you run a farm or work in agronomy this may be obvious, but the decision theory behind soil sampling can get complicated. This also isn't just a formula to find the perfect answer and locations, it is actually a series of compromises and best practices.
What we will describe in this blog post is:
- Why you should sample soil.
- Where you may want to sample a field.
- What depth should be sampled.
- What are some easy pitfalls to avoid.
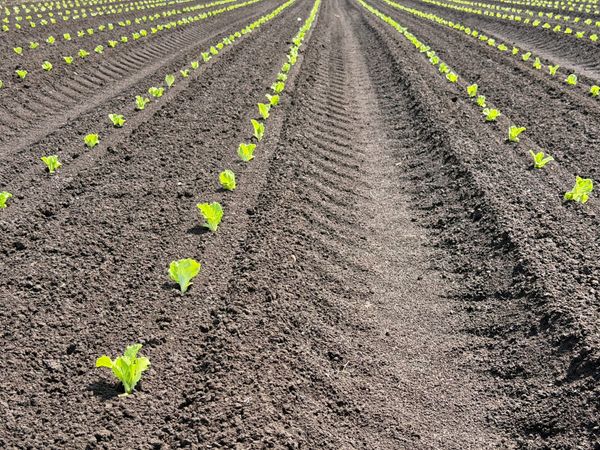
First up, why are we here in the first place? Should you be soil sampling at all? Personally, in most contexts I see many reasons for why you would want to sample but those reasons vary widely based on your land and its use. If you own a farm primarily growing grains and pulses then it largely depends on your experience and knowledge but getting a baseline reading down to 120cm or deeper every so often can inform management decisions like discovering nutritional limiting factors like phosphorus over and above annual nitrogen (N) budgeting (something we'll discuss in another post.) For horticultural crops samples beyond 30cm deep are largely unnecessary due to reduced time in ground and rooting capacity of common crops.
This is the core of what you are trying to accomplish with soil sampling, if a lab can analyse a representative sample of a field they can tell you what it is made up of. This allows you to apply management practices based on objective numbers. These includes numbers like organic carbon, nitrogen, potassium, oxygen, calcium, magnesium and even contaminates like cadmium, lead and residual herbicides. Without knowing the makeup of the soil it is inadvisable to apply fertilisers as it may result in toxicity to the plants you wish to grow.
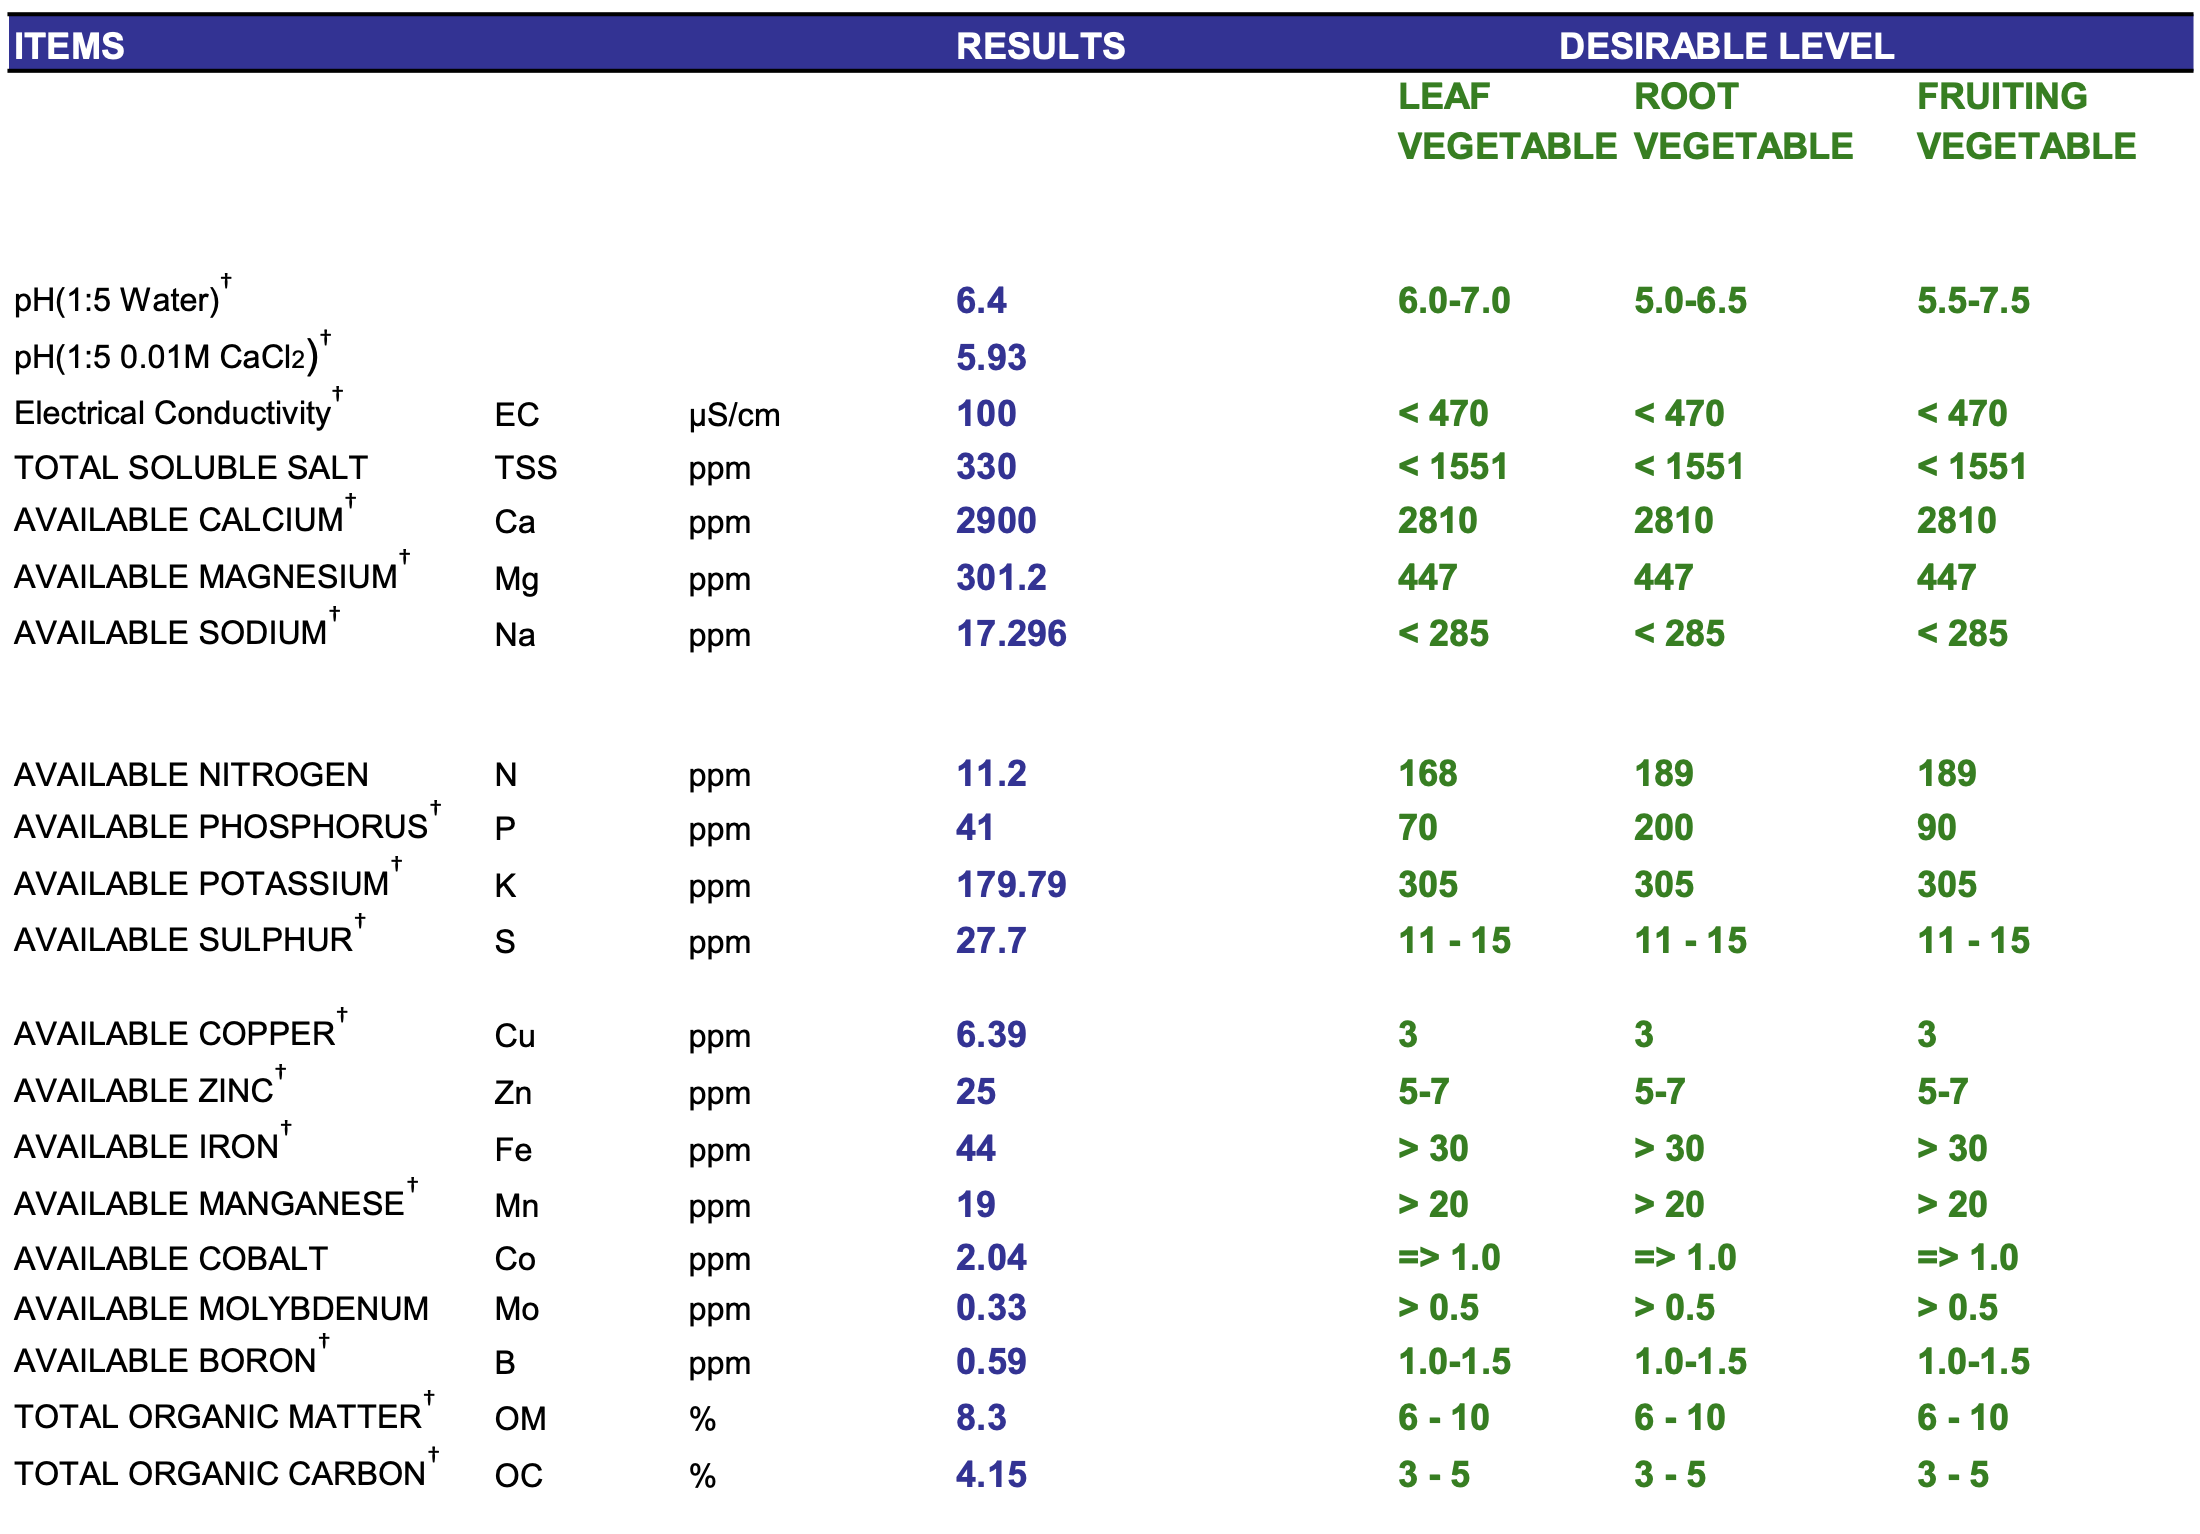
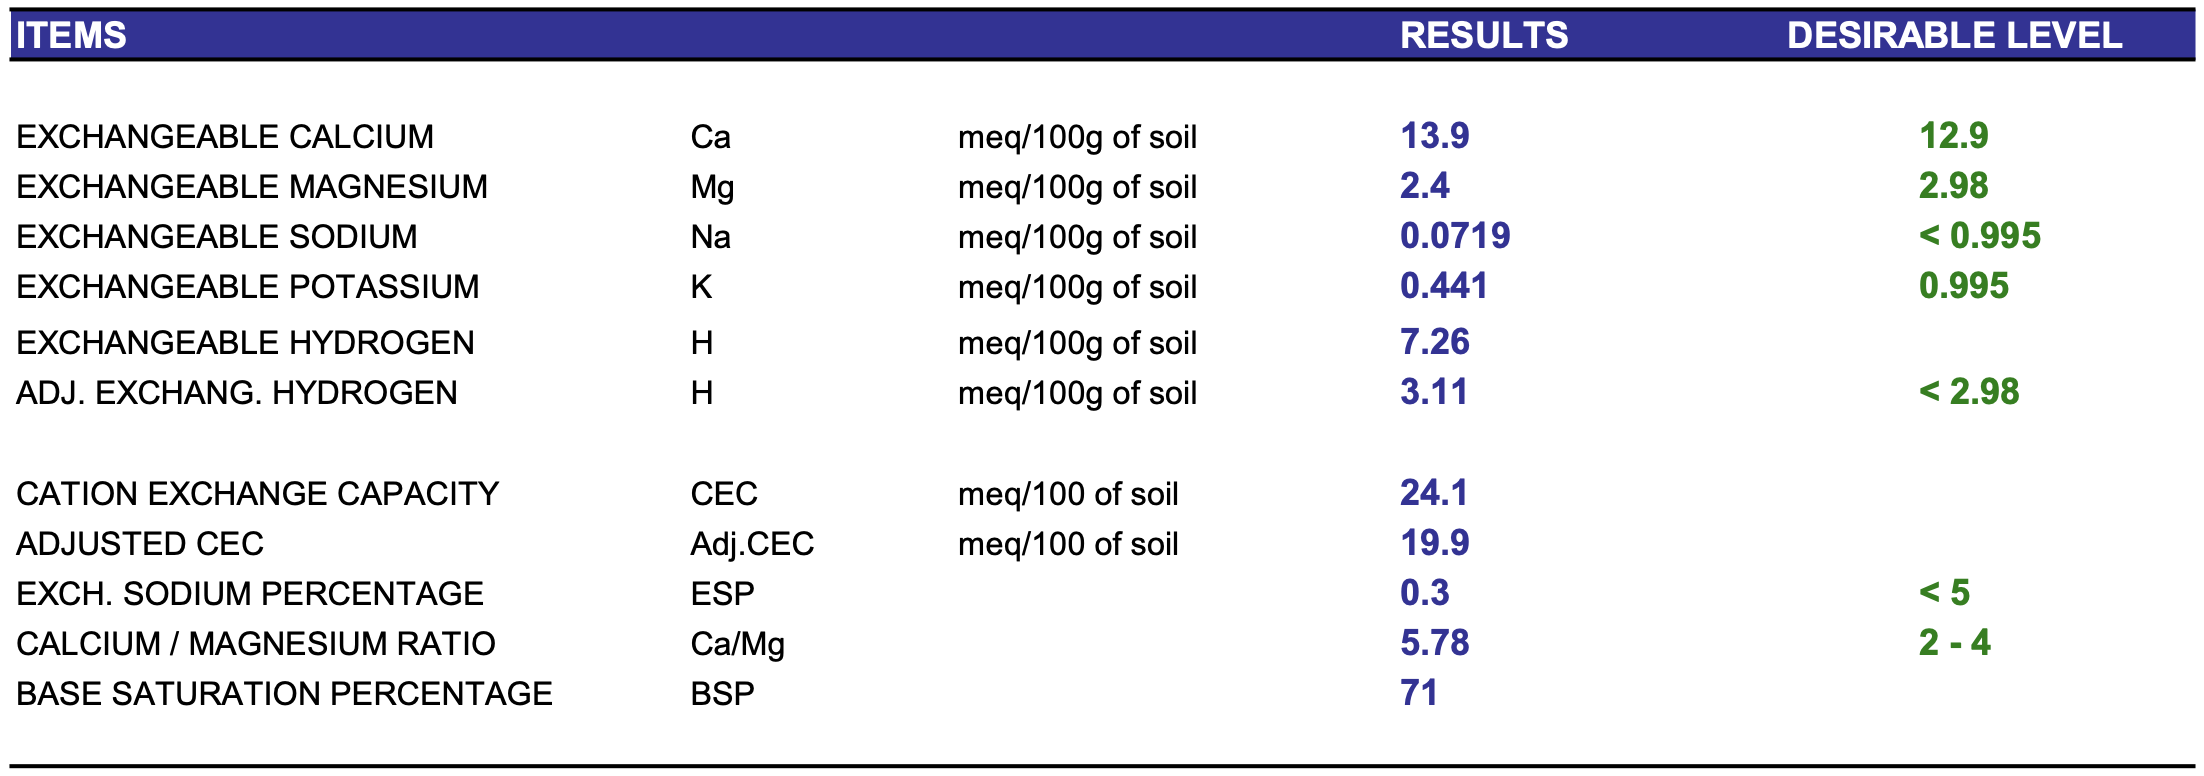
Seeing the above soil test results, some critical points should be mentioned which can lead to pitfalls when calculating for action steps based on these results. First, parts per million (ppm) is not the only measurement used, here there are also percentages (%) and microsiemens per centimetre (µS/cm) for organic matter/carbon and electrical conductivity respectively. These are in addition to pH and the interesting milliequivalents per 100 grams of soil (meq/100g of soil) for exchangeable cations. All these measurements use different calculation methods to convert this raw data into useful application rates or action steps for growers or home gardeners. The process of making this data useful will have to wait for a later post where I'll dive deep into these concepts, but for now seeing these results from my vegetable garden is designed to get you interested in understanding the data that can result from testing. These results are similar to what you would get in a full soil characterisation and are going to be more expensive than just testing for nitrogen.
Other considerations involve the depth of sampling, decision making on that depends highly on the crop you are growing and the expected depth of their roots. Rooting depth can also be limited by subsurface soil constraints such as high levels of sodium (Na) lower in the profile. Having a constraint like that is similar to hitting bedrock and there may be little to nothing you can do about it. Performing a characterisation test at different levels can help identify these constraints and at what depths they occur. This is key, if we mixed all the layers down to 120 or 150cm deep and tested a sample it may show high N and low Na levels. In reality there may be low Na and N at the surface and high Na and N below say 60cm.
By breaking the testing into depth levels it allows you to get a two dimensional look at the soil. Seeing that the soil constraint starts at a certain depth or that all the P you've applied is stratified on the surface, refusing to move down the profile, makes decision making easier. Agriculture industry standard testing depths, at least in Australia are 0-10, 10-30, 30-60, 60-90, 90-120 and 120-150cm. This not only roughly correlates with soil layers but more importantly gives a consistent measuring stick to compare results. Large amounts of data start getting produced as the above test results are received for each of the six depths on each soil type you bulk. A typical paddock then may lead to the amount of data in my example above times by 10-18, or more depending on depth sampled and soil types.
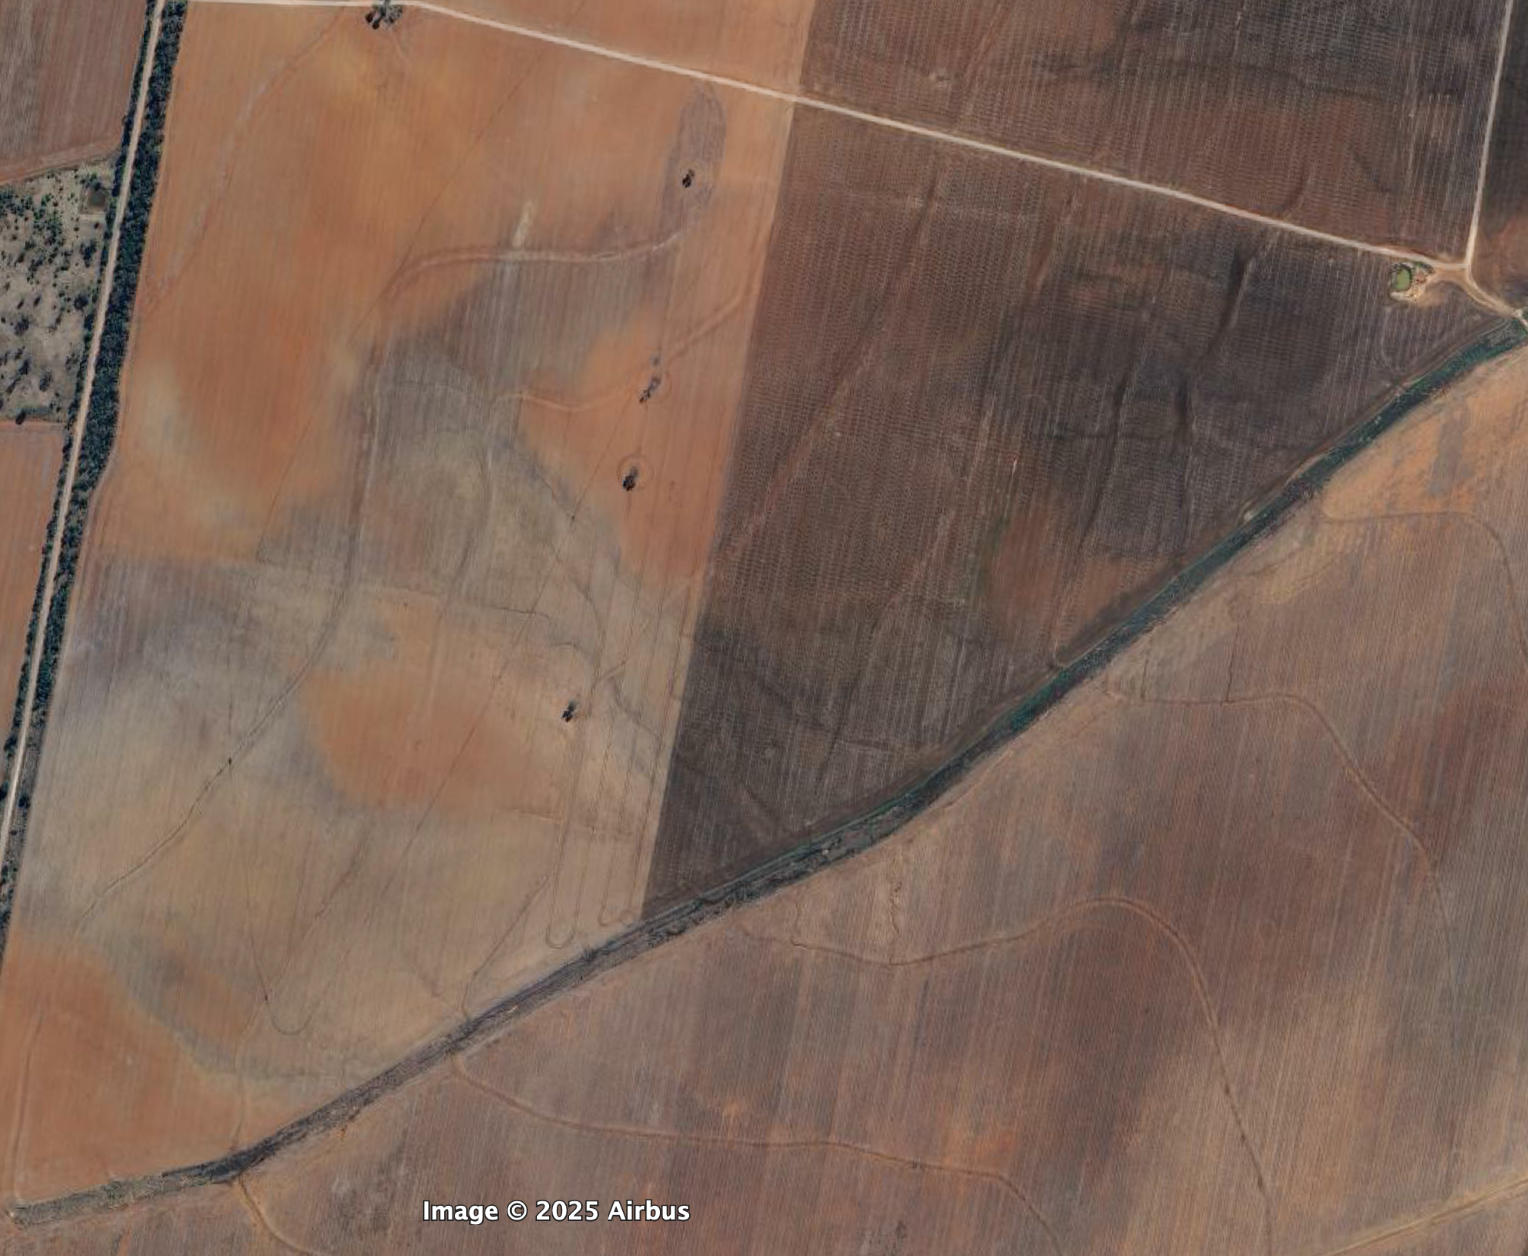
The testing on different soil types is how testing can give us a three dimensional look at what is likely going on. This brings us to the conclusion where it should be remembered that just because we have some numbers doesn't mean they are accurate. Even with 20 plus soil tests from a paddock there is still some soil out there (hopefully) that wasn't tested and that may give you different numbers when tested. Remember, soil sampling is full of compromises depending on locations tested, soils combined, depths chosen, tests requested and limitations of testing methods. No test is perfect and treat any results or management decisions with an appropriate amount of 'salt' based on your sampling decision making.
Look out for future posts here where I will dive deeper into choosing sampling locations and strategies for getting core locations to ensure better representative samples. I will also write about lab testing, how it works and its limitations. Subscribe for future posts to be emailed to your inbox.